Cost optimisation of compression algorithms
We're using a GCP cloud function to compress and send data to GCP cloud storage, as part of an archival process.
The challenge is: how do we compress the data in order to minimise cost? What algorithm do we use? What quality setting should we choose? Should we even compress it at all?
We want the cloud function to run quickly (because we're billed by function runtime), and we want to compress the data a lot so it shrinks down and our storage costs are very small. The problem is that increasing the amount of compression also increases the amount of time the compression algorithm takes to run, and therefore the cost of the cloud function.
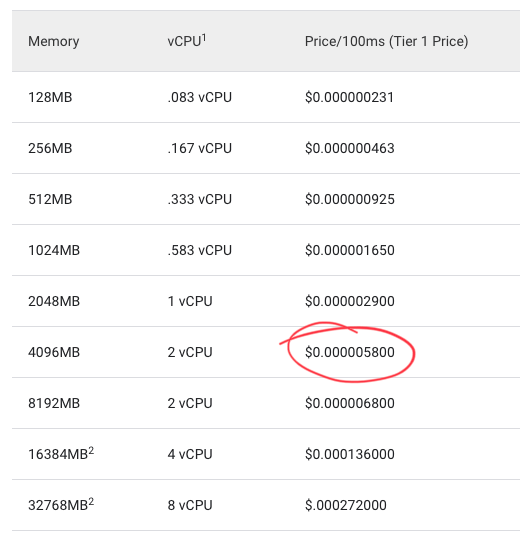
So now we have an optimisation problem! We know the cost of cloud function runtime:
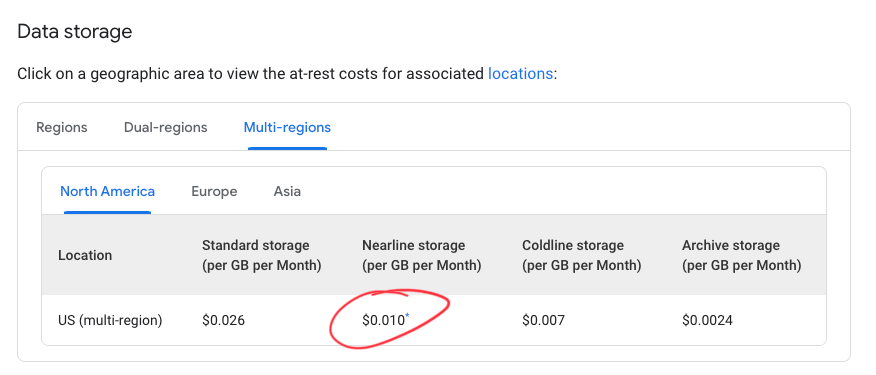
And we know the cost of cloud storage:
So we can combine these to make an optimisation cost function:
# from per 100ms to per ms
cloud_function_cost = 0.000005800 / 100

# from GB/mo to B/year
storage_cost = 0.010 * 12 / 1e9

cost = (
   # storage
   file_size * storage_cost +

   # cloud function
   compression_duration * cloud_function_cost
)
Compression
To start with, I grabbed a ~10MB sample of the data we were planning to compress, and saved it as data. I wrote a node function to compress some given data using brotli or gzip with a chosen quality setting (a number between 0 and 11 for brotli, and 1 and 9 for gzip - higher means more compression).
// compress.js
import { promisify } from 'node:util'
import { brotliCompress, constants, gzip } from 'node:zlib'

const doBrotliCompress = promisify(brotliCompress)
const doGzipCompress = promisify(gzip)

export const compress = async (data, algorithm, quality = 6) => {
  if (algorithm == 'brotli') {
    return await doBrotliCompress(data, {
      params: {
        [constants.BROTLI_PARAM_QUALITY]: quality,
        [constants.BROTLI_PARAM_SIZE_HINT]: data.length,
      },
    })
  } else if (algorithm == 'gzip') {
    return await doGzipCompress(data, { level: quality })
  }
}
I then wrote a test script that would load the data in, compress it using each quality setting, time how long it takes and the data size before and after compression, and then output these results to results.json. We're running each test 10 times so that we can later average the compression duration.
// compare.js
import { readFile, writeFile } from 'node:fs/promises'
import { hrtime } from 'process'
import { compress } from './compress.js'

const NUM_SAMPLES = 10

const startTimer = () => hrtime.bigint()

const getDuration = (start) => {
  const end = hrtime.bigint()
  const duration = Number((end - start) / BigInt(1e6))
  return duration
}

const getData = async () => {
  // load sample data from file
  const data = await readFile('./data')
  return data
}

const compressData = async (data, algorithm, quality) => {
  const timer = startTimer()
  const compressed = await compress(data, algorithm, quality)

  const duration = getDuration(timer)

  const size = Buffer.byteLength(data)
  const sizeCompressed = Buffer.byteLength(compressed)

  return { size, sizeCompressed, duration, algorithm, quality }
}

const writeResults = async (results) => {
  const jsonData = JSON.stringify(results, undefined, 2)
  await writeFile('results.json', jsonData)
}

const minQuality = { brotli: 0, gzip: 1 }
const maxQuality = { brotli: 11, gzip: 9 }

const runCompressionTest = async () => {
  const data = await getData()

  const results = []

  for (const algorithm of ['brotli', 'gzip']) {
    const minQ = minQuality[algorithm]
    const maxQ = maxQuality[algorithm]

    for (let i = 0; i < NUM_SAMPLES; i++) {
      for (let quality = minQ; quality <= maxQ; quality++) {
        const result = await compressData(data, algorithm, quality)
        console.log(result)
        results.push(result)
      }
    }
  }

  await writeResults(results)
}

await runCompressionTest()
This runs for a few minutes, then outputs the following data:
// results.json
[
  {
    "size": 10077825,
    "sizeCompressed": 5239472,
    "duration": 48,
    "algorithm": "brotli",
    "quality": 0
  },
  {
    "size": 10077825,
    "sizeCompressed": 4904072,
    "duration": 58,
    "algorithm": "brotli",
    "quality": 1
  },
  ...
]
Analysis
Now, we can hop over to a jupyter notebook in order to analyse our results. I'm using pandas for data analysis/manipulation, and seaborn for the visualisations.
import pandas as pd
import seaborn as sns
import matplotlib.pyplot as plt

df = pd.read_json('./results.json')

# add compression ratio
df['ratio'] = df['size'] / df['sizeCompressed']
| size | sizeCompressed | duration | algorithm | quality | ratio | |
|---|---|---|---|---|---|---|
| 0 | 10077825 | 5239472 | 48 | brotli | 0 | 1.923443 |
| 1 | 10077825 | 4904072 | 58 | brotli | 1 | 2.054991 |
| 2 | 10077825 | 4587855 | 101 | brotli | 2 | 2.196631 |
| ... | ... | ... | ... | ... | ... | |
| 207 | 10077825 | 4502383 | 295 | gzip | 7 | 2.238331 |
| 208 | 10077825 | 4500981 | 577 | gzip | 8 | 2.239029 |
| 209 | 10077825 | 4501332 | 852 | gzip | 9 | 2.238854 |
This looks correct - we can see that as we increase the compression quality (0, 1, 2, ...) the compression ratio also increases (1.9, 2.05, 2.2, ...).
Let's visualise this. Seaborn is great for plots like this where there are more than two variables.
sns.relplot(
    data=df,
    x="quality",
    y="ratio",
    hue="algorithm",
    height=5
)
plt.title('Compression ratio vs quality')
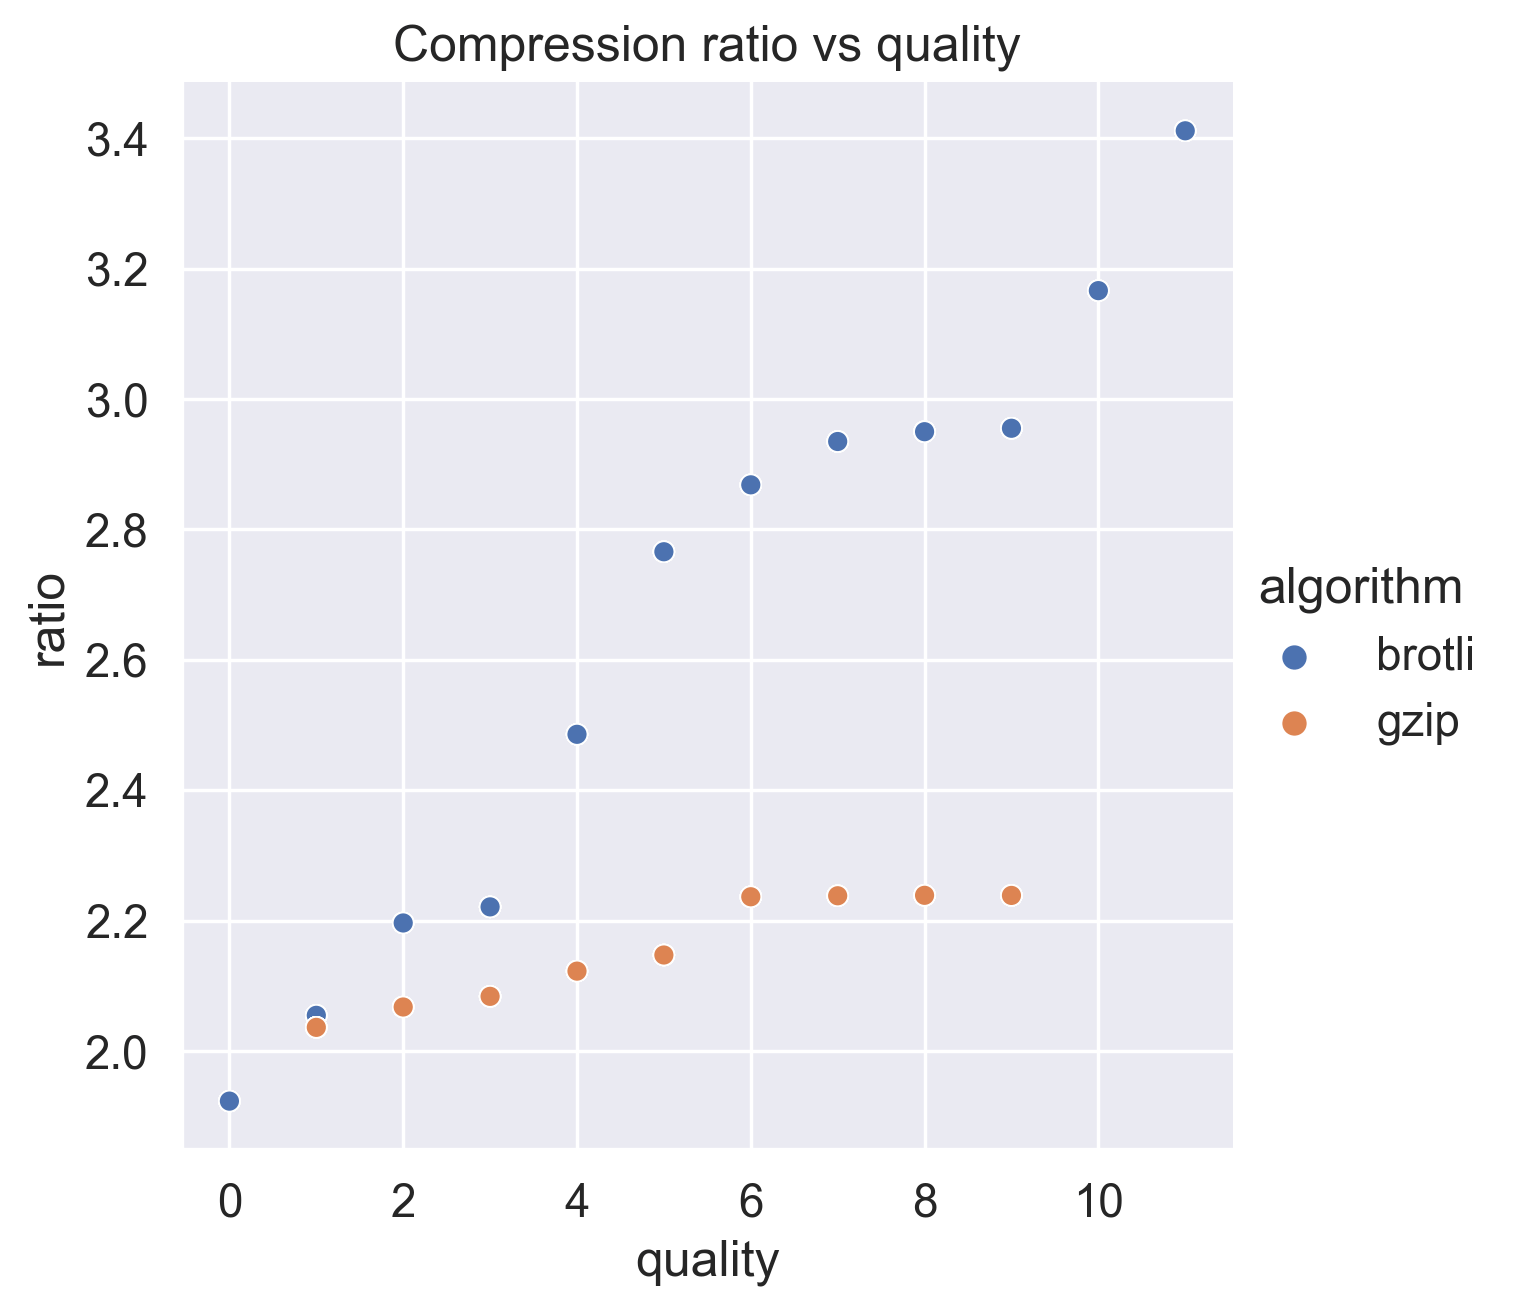
This shows that brotli is capable of much higher compression ratios than gzip! With high quality settings it can compress our data down to more than 3x smaller than it's original size.
Let's have a look at the effect on function duration:
ax = sns.relplot(
    data=df,
    x="quality",
    y="duration",
    hue="algorithm",
    height=5
)
plt.ylabel('duration (ms)')
plt.title('Compression time vs quality setting')
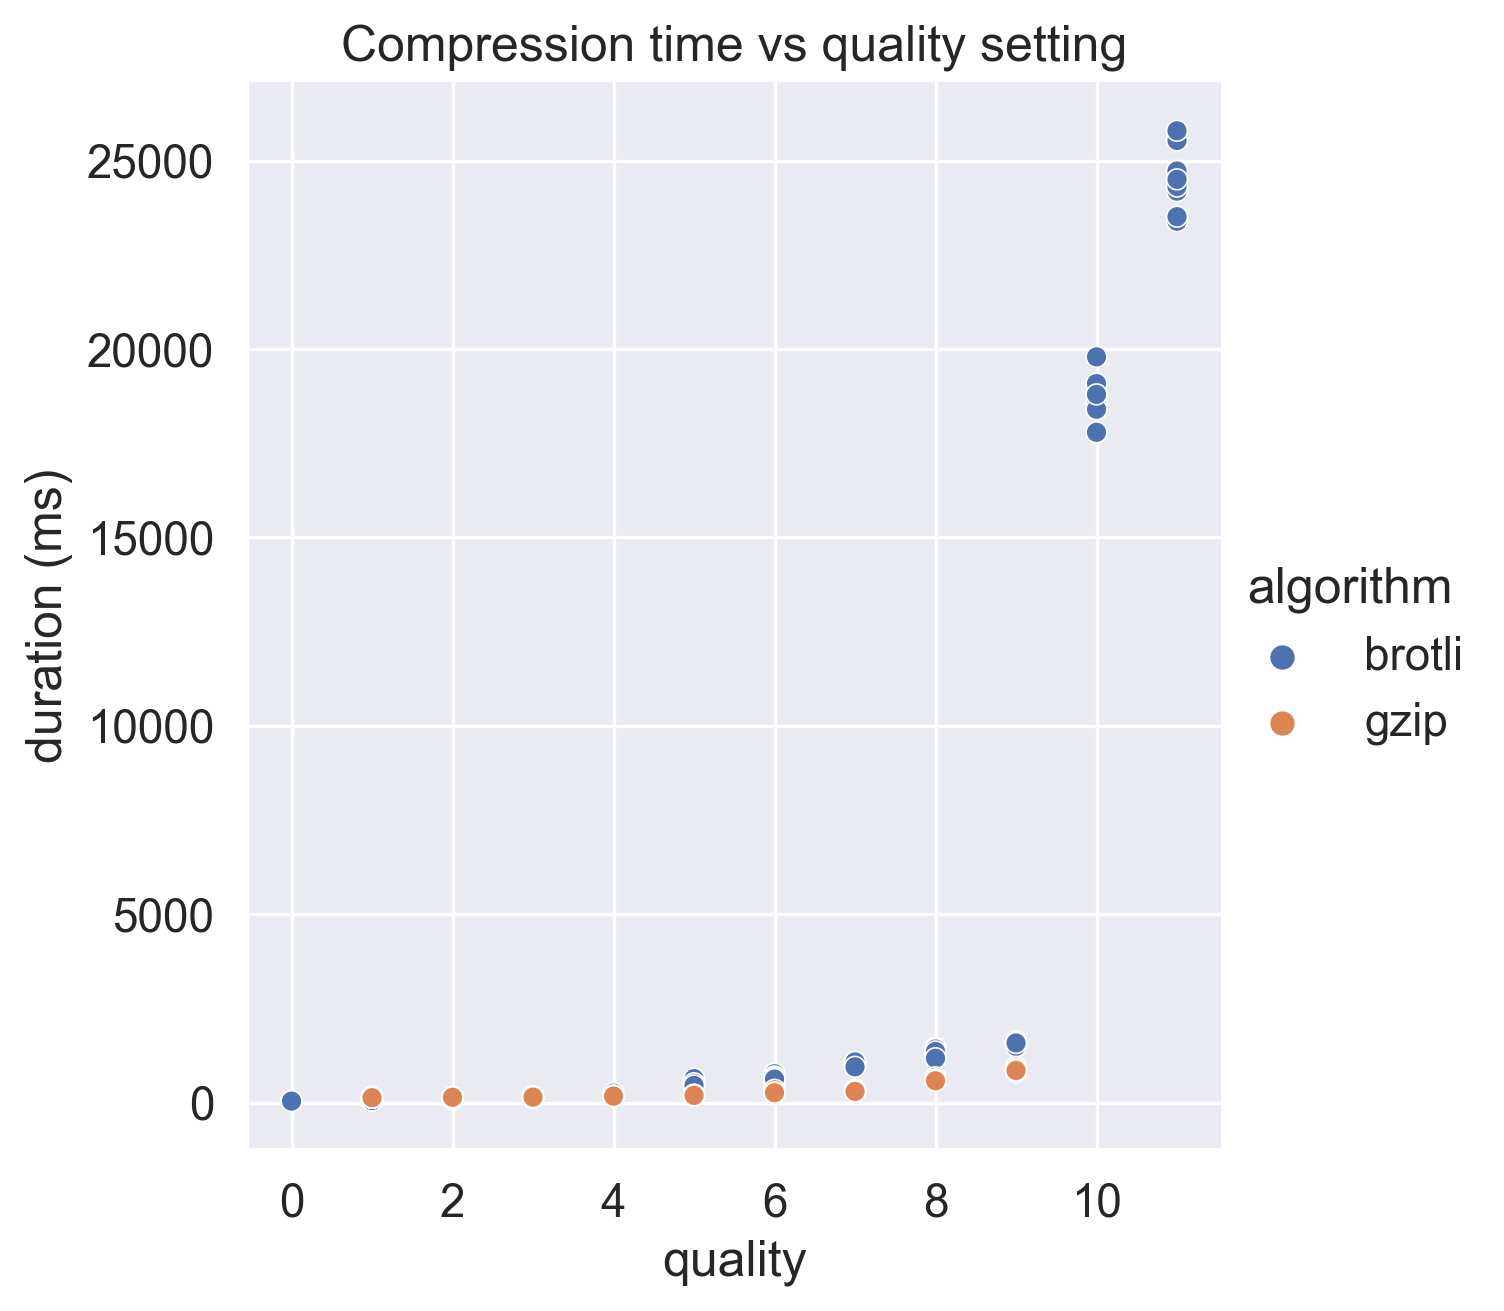
Woah - the highest quality settings are really slow - let's try removing those, and see what the graph looks like. We can use a stripplot with low alpha to better show the distribution of the 10 samples:
sns.stripplot(
    data=df[df.quality<10],
    x="quality",
    y="duration",
    hue="algorithm",
    alpha=.25,
)

g = sns.pointplot(
    data=df[df.quality<10],
    x="quality",
    y="duration",
    hue="algorithm",
    join=False,
    palette="dark",
    markers="d",
    scale=.75,
    legend=False
)
plt.ylabel('duration (ms)')
plt.title('Compression time vs quality setting')

handles, labels = plt.gca().get_legend_handles_labels()
_ = plt.gca().legend(handles[:2], labels[:2])
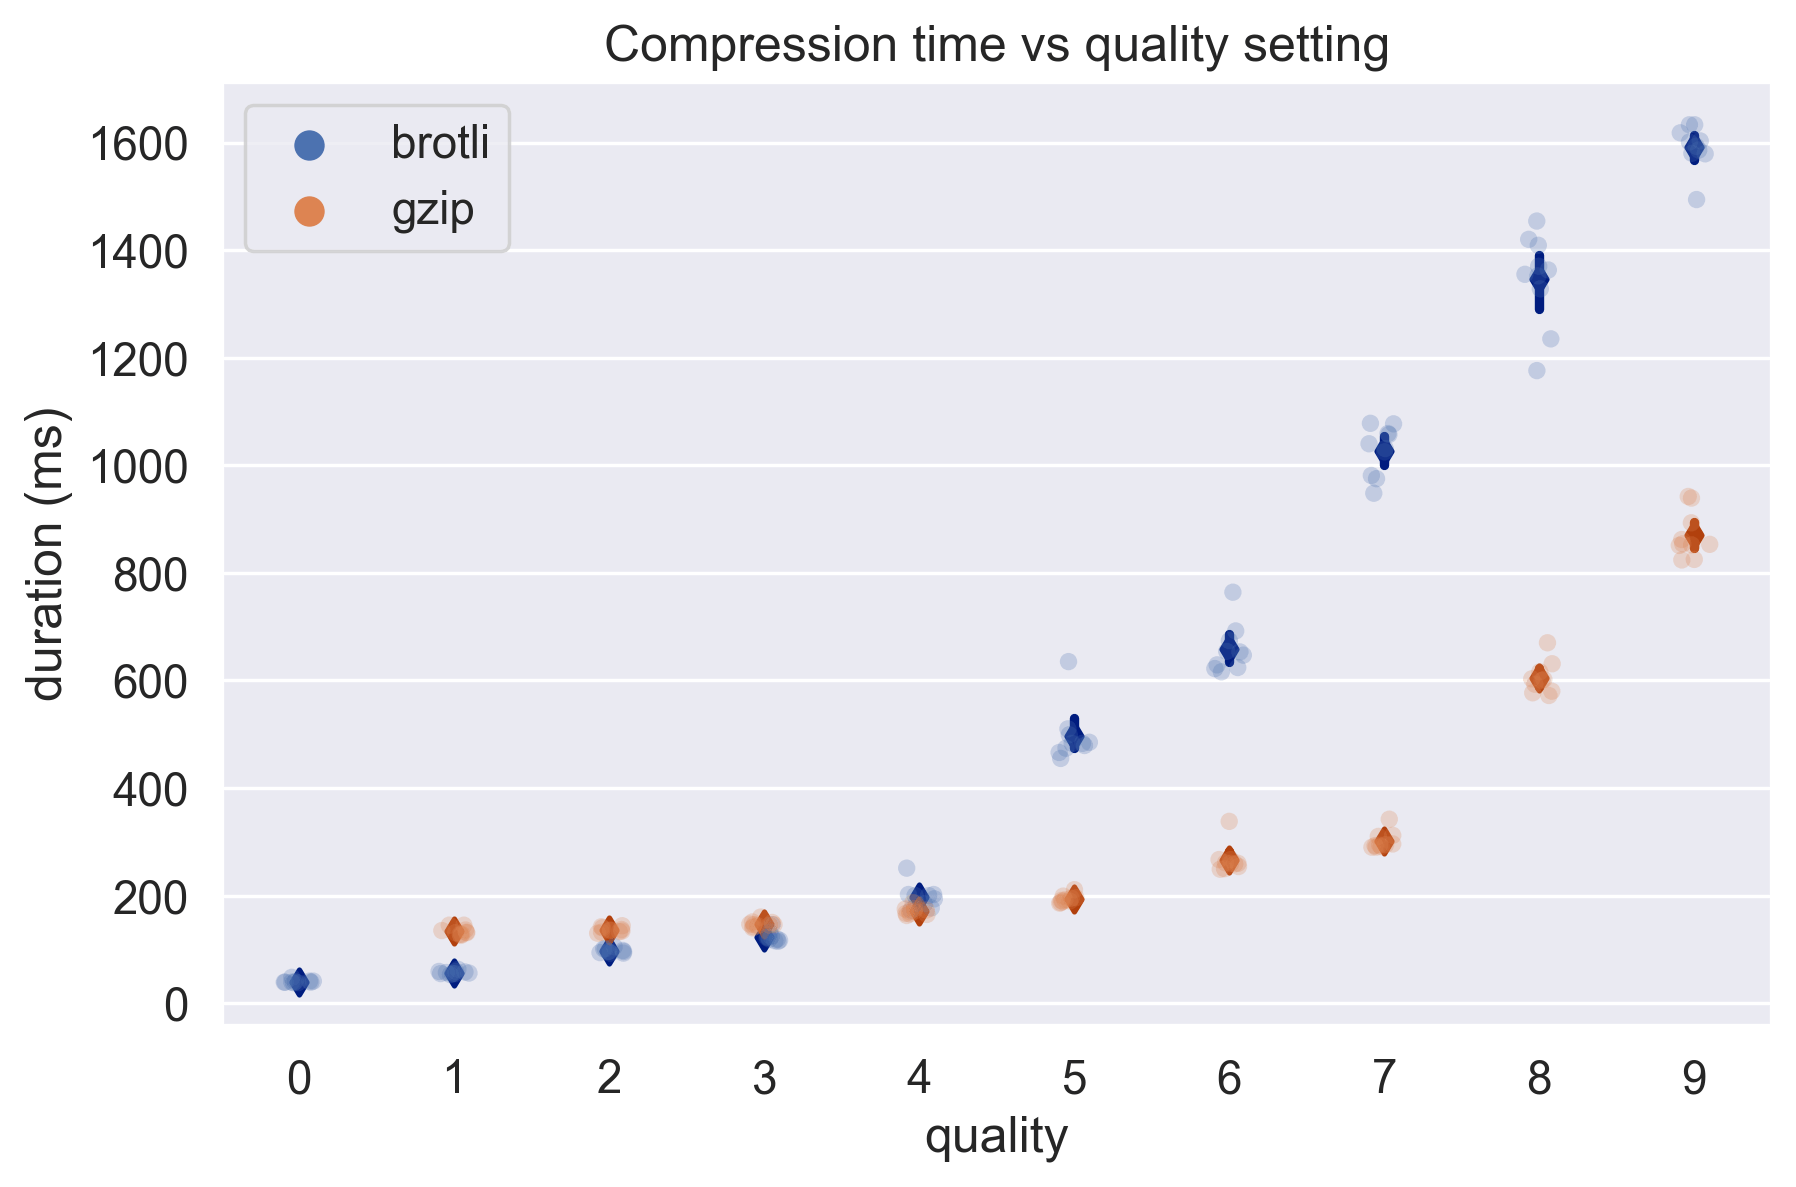
Excellent, this is what we expected - as the quality setting increases, so does the compression duration. Brotli is slower than gzip, however we know from our compression ratio graph that it also compresses a lot more.
Now we can add in the cost function, so we can work out the optimal algorithm and quality setting:
# from per 100ms to per ms
cloud_function_cost = 0.000005800 / 100

# from GB/mo to B/year
storage_cost = 0.010 * 12 / 1e9

df['cost'] = df.sizeCompressed * storage_cost + df.duration * cloud_function_cost
And we can plot the result:
sns.stripplot(
    data=df[df.quality<10],
    x="quality",
    y="cost",
    hue="algorithm",
    alpha=.25,
)

sns.pointplot(
    data=df[df.quality<10],
    x="quality",
    y="cost",
    hue="algorithm",
    join=False,
    palette="dark",
    markers="d",
    scale=.75,
    legend=False
)

plt.ylabel('cost (lower is better)')
plt.title('Cost vs quality')

handles, labels = plt.gca().get_legend_handles_labels()
_ = plt.gca().legend(handles[:2], labels[:2])
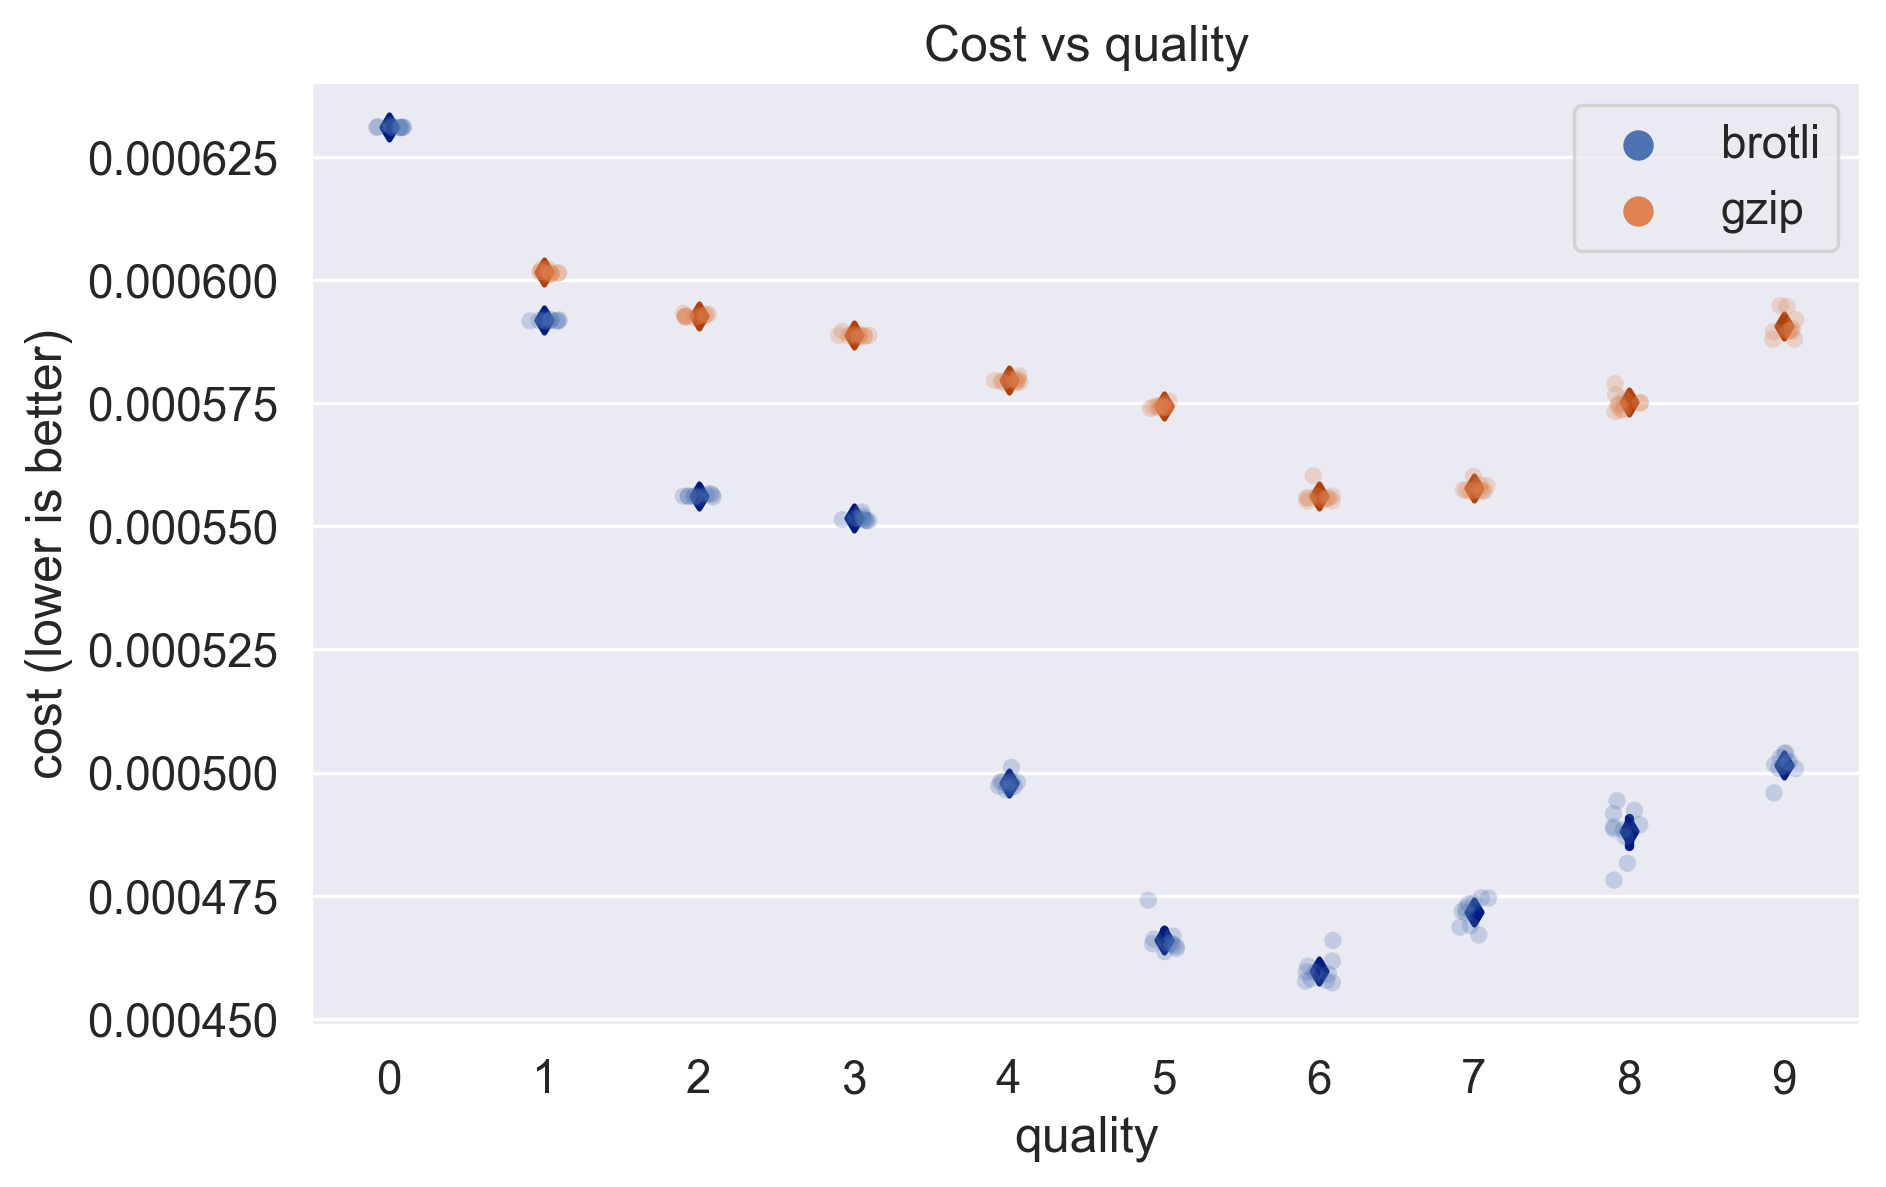
From this we can determine that brotli with a quality setting of 6 will result in the optimal balance between compression and runtime, and therefore the lowest cost!