Hardware watchdog
A watchdog service is designed to monitor a running system -- on a regular interval if the system is healthy the service will reset a hardware counter by sending a keepalive message. If the counter gets to zero then the hardware will perform a hard restart. It's designed to handle unrecoverable errors, like when the operating system freezes. The watchdog service will stop running, the hardware counter will count down to zero (since it's not being reset) and the machine will restart and recover.
A lot of modern servers have a builtin hardware watchdog chip, in Linux this is found at /dev/watchdog. On the server I was using this was created by the iTCO-wdt kernel module - in dmesg we can see more details:
[  110.965993] iTCO_wdt: Intel TCO WatchDog Timer Driver v1.11
[  110.966036] iTCO_wdt: Found a Lynx Point_LP TCO device (Version=2, TCOBASE=0x1860)
[  110.966482] iTCO_wdt: initialized. heartbeat=30 sec (nowayout=0)
In this case the heatbeat is set to 30 seconds, so we should ensure /dev/watchdog is pinged at least every 10 seconds - that way the machine won't reboot if the daemon is a little slow or misses one ping.
There are a few options for watchdog daemons. Systemd has one that your systemd services can integrate with - if your services fail then the hardware watchdog will stop being reset. I went with watchdog because it had a series of inbuilt checks, such as:
- Has the network interface recieved any traffic?
- Is the system temperature too high? (This expects you to be using
lm_sensors) - Is the average system load below some threshold?
The setup is reasonable straightforward - I installed the daemon with apt-get install watchdog, then modified /etc/watchdog.conf as follows:
# Monitor primary network interface
interface          = enp0s25

# Ping the router
ping               = 172.16.1.1

# Load average thresholds
# (1 minute is disabled to prevent sudden spikes from causing a hard reset)
# max-load-1         = 30
max-load-5         = 30
max-load-15        = 20

watchdog-device    = /dev/watchdog
watchdog-timeout   = 60

# Temperature sensor location (see lm_sensors)
temperature-sensor = /sys/devices/platform/coretemp.0/hwmon/hwmon1/temp1_input
max-temperature    = 95

# Run interval
interval           = 5
log-dir            = /var/log/watchdog
logtick            = 5
verbose            = yes
realtime           = yes
priority           = 1

# Name of the file for diagnostic heartbeat
# writes a time_t value (in ASCII) on each write to the watchdog device.
heartbeat-file     = /var/log/watchdog/heartbeat
heartbeat-stamps   = 1000
Monitoring
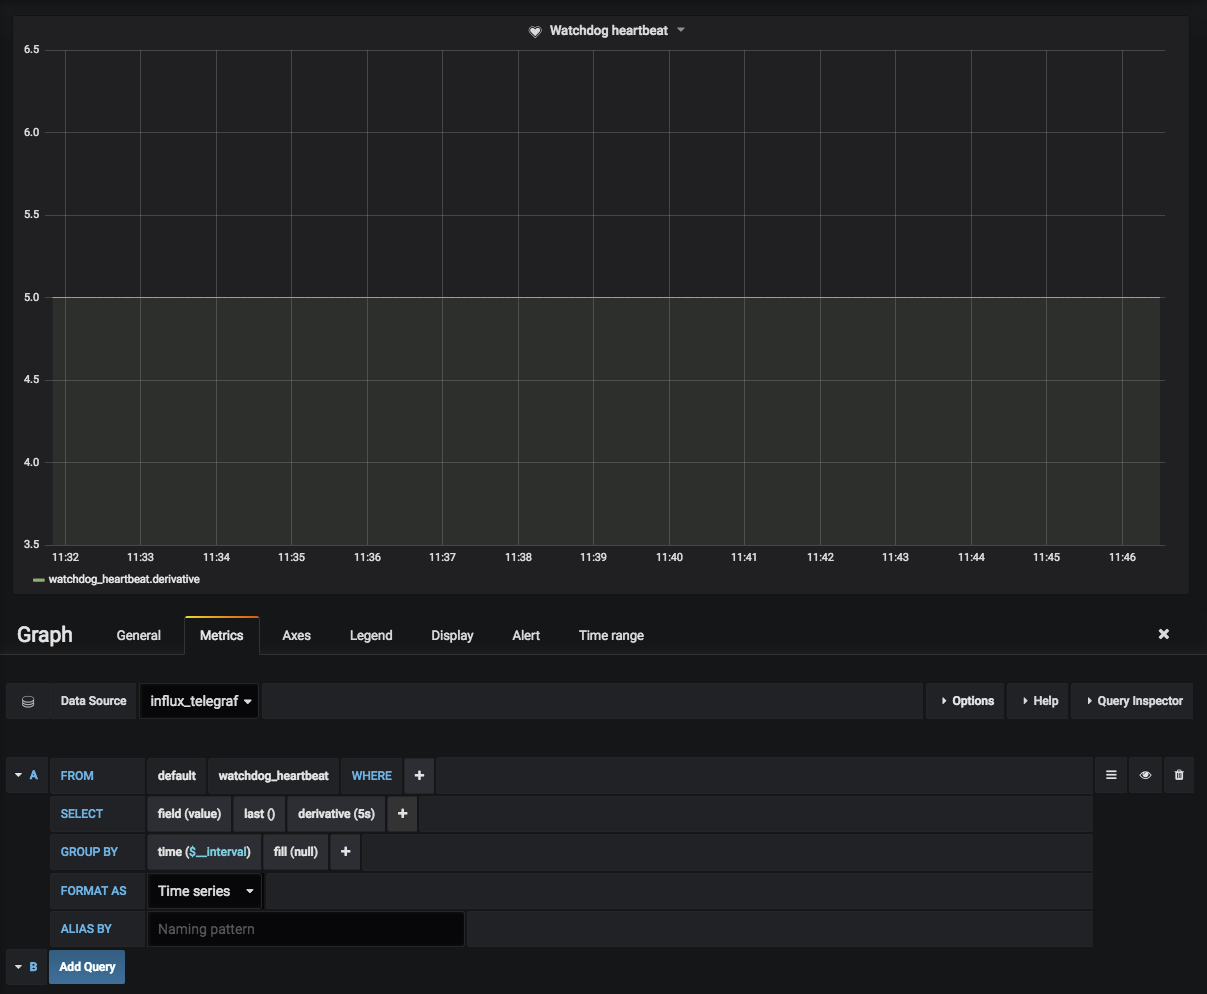
I used the heartbeat-file to monitor the heartbeat with Telegraf:
[[inputs.exec]]
  commands = ["tail -n 1 /var/log/watchdog/heartbeat"]
  name_override = "watchdog_heartbeat"
  data_format = "value"
  data_type = "integer"
This allows us to see in Grafana that the watchdog is working, and resetting every 5 seconds (as specified by interval in the config):
Temperature
When the watchdog daemon detects that the onboard temperature is above the threshold, it tries a clean shutdown. Here are some logs from a server that reached 86 degrees with the threshold set to 85 degrees:
May 25 19:49:52 server watchdog[17818]: current load is 3 3 3
May 25 19:49:52 server watchdog[17818]: current temperature is 78.000 for /sys/devices/platform/coretemp.0/hwmon/hwmon1/temp1_input
May 25 19:49:52 server watchdog[17818]: device enp0s25 received 4718599051 bytes
May 25 19:49:52 server watchdog[17818]: got answer on ping=1 from target 172.16.1.1      time=0.989ms
May 25 19:49:57 server watchdog[17818]: still alive after 980 interval(s)
May 25 19:50:02 server watchdog[17818]: temperature increases above 83 (/sys/devices/platform/coretemp.0/hwmon/hwmon1/temp1_input)
May 25 19:50:02 server watchdog[17818]: it is too hot inside (temperature = 86 >= 85 for /sys/devices/platform/coretemp.0/hwmon/hwmon1/temp1_input)
May 25 19:50:02 server watchdog[17818]: shutting down the system because of error 252 = 'too hot'
May 25 19:50:02 server watchdog[17818]: /usr/lib/sendmail does not exist or is not executable (errno = 2)
Since we didn't have sendmail configured, we didn't get an alert with an explanation, our monitoring just picked up that the server had gone away.
In the watchdog daemon source code we can see that the log message we recieved above was from here:
    if ((stat(PATH_SENDMAIL, &buf) != 0) || ((buf.st_mode & S_IXUSR) == 0)) {
        log_message(LOG_ERR, "%s does not exist or is not executable (errno = %d)", PATH_SENDMAIL, errno);
    } else {
        sprintf(exe, "%s -i %s", PATH_SENDMAIL, admin);
        ...
Since all our alerts came through Slack rather than via email (and I didn't want to have to set up sendmail), I wrote a quick python program that would accept input in the same format as sendmail but send off a POST request to a slack webhook instead.
#!/usr/bin/env python3
import sys
import json
import requests

slack_url = "https://hooks.slack.com/services/<webhook URL>"


def get_subject(lines):
    try:
        # Find subject
        for line in lines:
            if line.startswith('Subject:'):
                subject = line.split(':', 1)[1]
                return subject.strip()
    except Exception as e:
        print('get_subject exception', e)
        return ''


def get_body(lines):
    try:
        # Find body
        for i, line in enumerate(lines):
            # first blank line
            if line == '\n':
                body_lines = lines[i + 1:]
                # list to string
                return ''.join(body_lines)
    except Exception as e:
        print('get_body exception', e)
        return ''

# Read from stdin until there is no more
lines = []
for line in sys.stdin:
    lines.append(line)

subject = get_subject(lines)
body = get_body(lines)

text = f'*{subject}*\n{body}'
slack_data = {'text': text}

# Fire and forget
requests.post(
    slack_url, data=json.dumps(slack_data),
    headers={'Content-Type': 'application/json'}
)
This was placed at /usr/lib/sendmail and set as executable:
sudo chmod +x /usr/lib/sendmail
This means now we get the following Slack message just before the server powers itself off:

Links
Some reference material:
I hope you find this useful!
